Dashboards
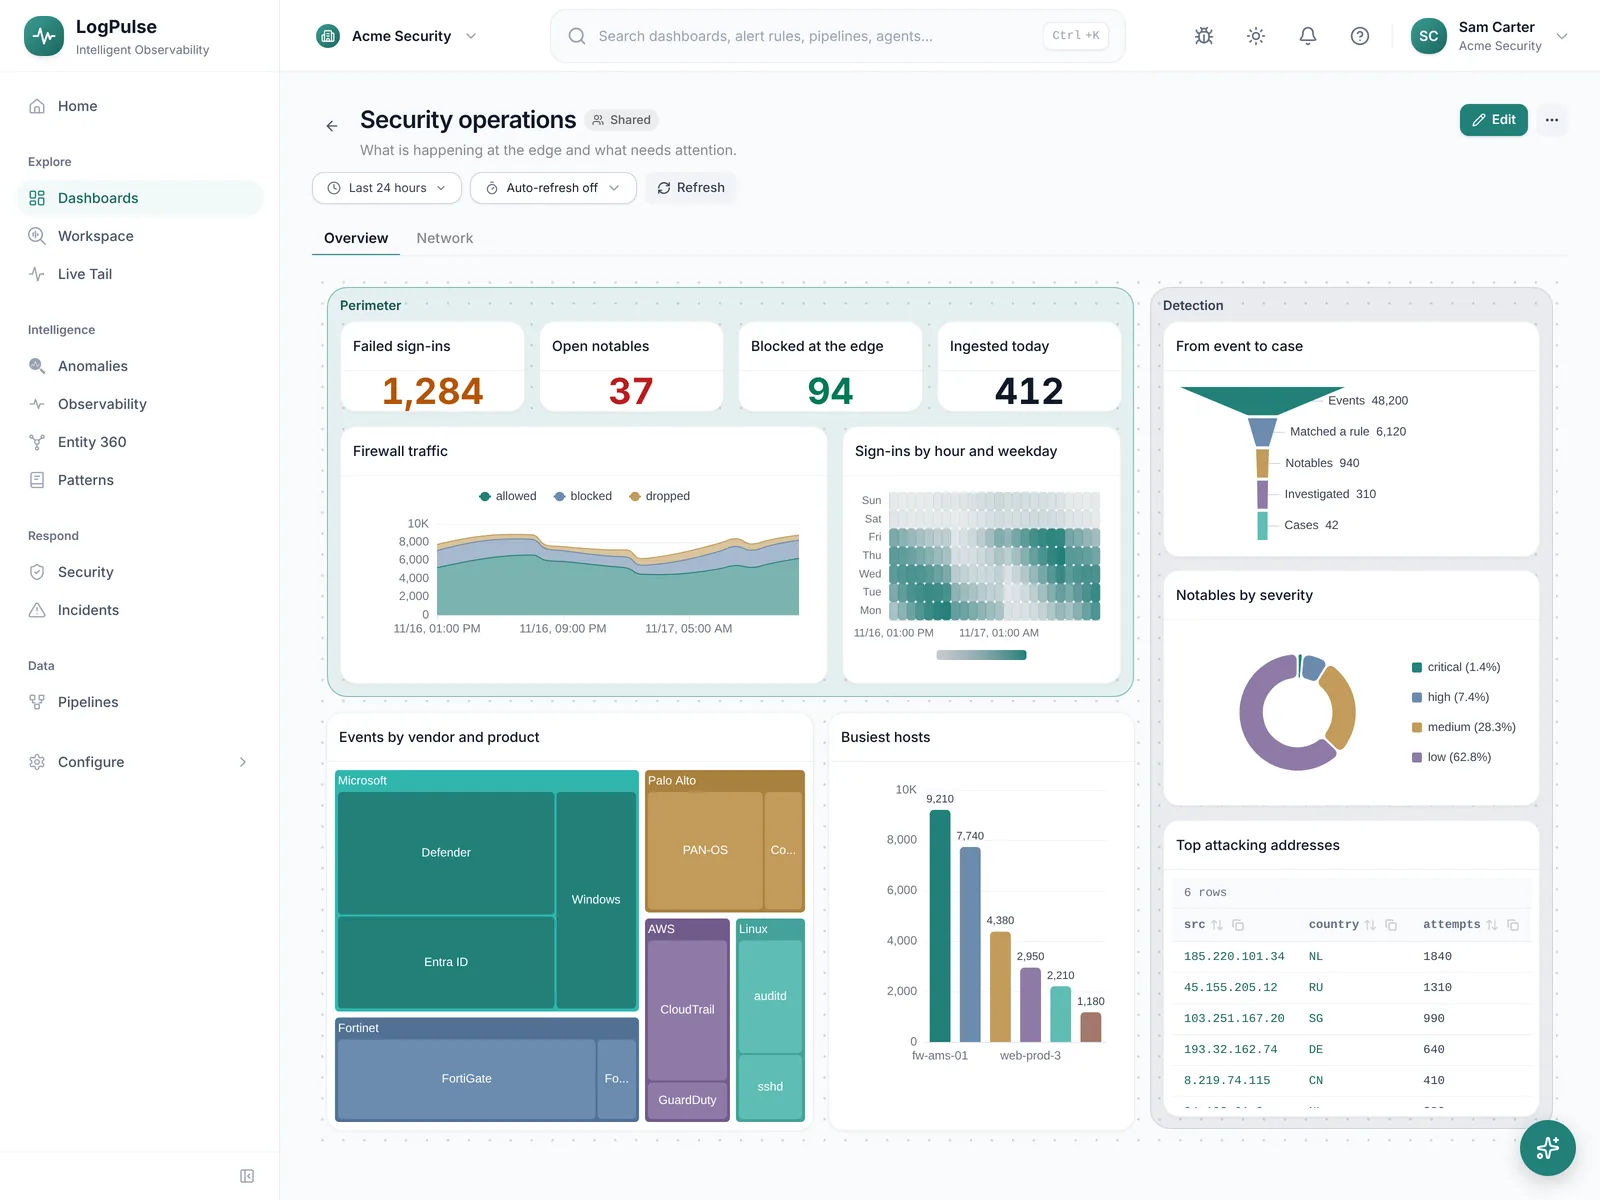
A dashboard keeps an eye on what matters: a few numbers, how they move, and the list behind them. This page explains everything you can build, from a first dashboard in five minutes to a wall screen with a floor plan, tabs and panels that react to a click.
What you can build
| You want to | Use | Read |
|---|---|---|
| See a few numbers and charts below each other | A grid dashboard | Your first dashboard |
| Put panels exactly where you want, on a picture or on top of each other | A canvas dashboard | Grid or canvas |
| Split a large dashboard in pages | Tabs | Tabs |
| Let people pick a server, user or zone | Filters | Filters |
| Click a value to see more | Click actions | What a click does |
| Show a detail panel only after a choice | Show only when | Show only when |
| Make a number amber or red above a limit | Colour rules | Colour by value |
| Write a search once for several panels | Shared searches | Shared searches |
| Hang it on the wall | Always dark, TV mode | Time, refresh and wall screens |
| Not build it yourself | The AI assistant | Let the AI assistant build it |
Your first dashboard
- Go to Dashboards and choose New dashboard. Give it a name that says what it watches, such as Web shop errors.
- The list on the left holds everything you can add, in three groups: Charts, Filters and Text & more. Drag Number onto the page.
- Type the search for the panel. A panel search ends in one number or one small table, so it ends with
stats,timechartortop. Start withindex=so it stays fast. - Add a Line for the trend and a Table for the detail. Drag panels to move them and drag an edge to resize.
- Press Save. Every save keeps the previous version, so you can always go back.
index=web level=error | stats count
index=web level=error | timechart count
index=web level=error | stats count by host, message | sort -count | head 20
Leave the time out of the search: the time picker at the top of the dashboard sets it for every panel. See LPQL syntax for everything a search can do.
Ready-made dashboards
You do not have to start from an empty page. LogPulse comes with 22 ready-made dashboards, one per kind of log: Windows, Linux, firewalls, web servers, sign-ins, cloud and more. Add one and it is yours. Nothing links it back to the library, so you can change every chart, copy it or delete it.
- Go to Dashboards and choose Ready-made.
- Dashboards you already have logs for carry a green label with the number of events of the last 24 hours. Choose For your logs to see only those.
- What is inside shows the charts per tab and the search the dashboard will read.
- Press Add. The dashboard opens with your own data in it.
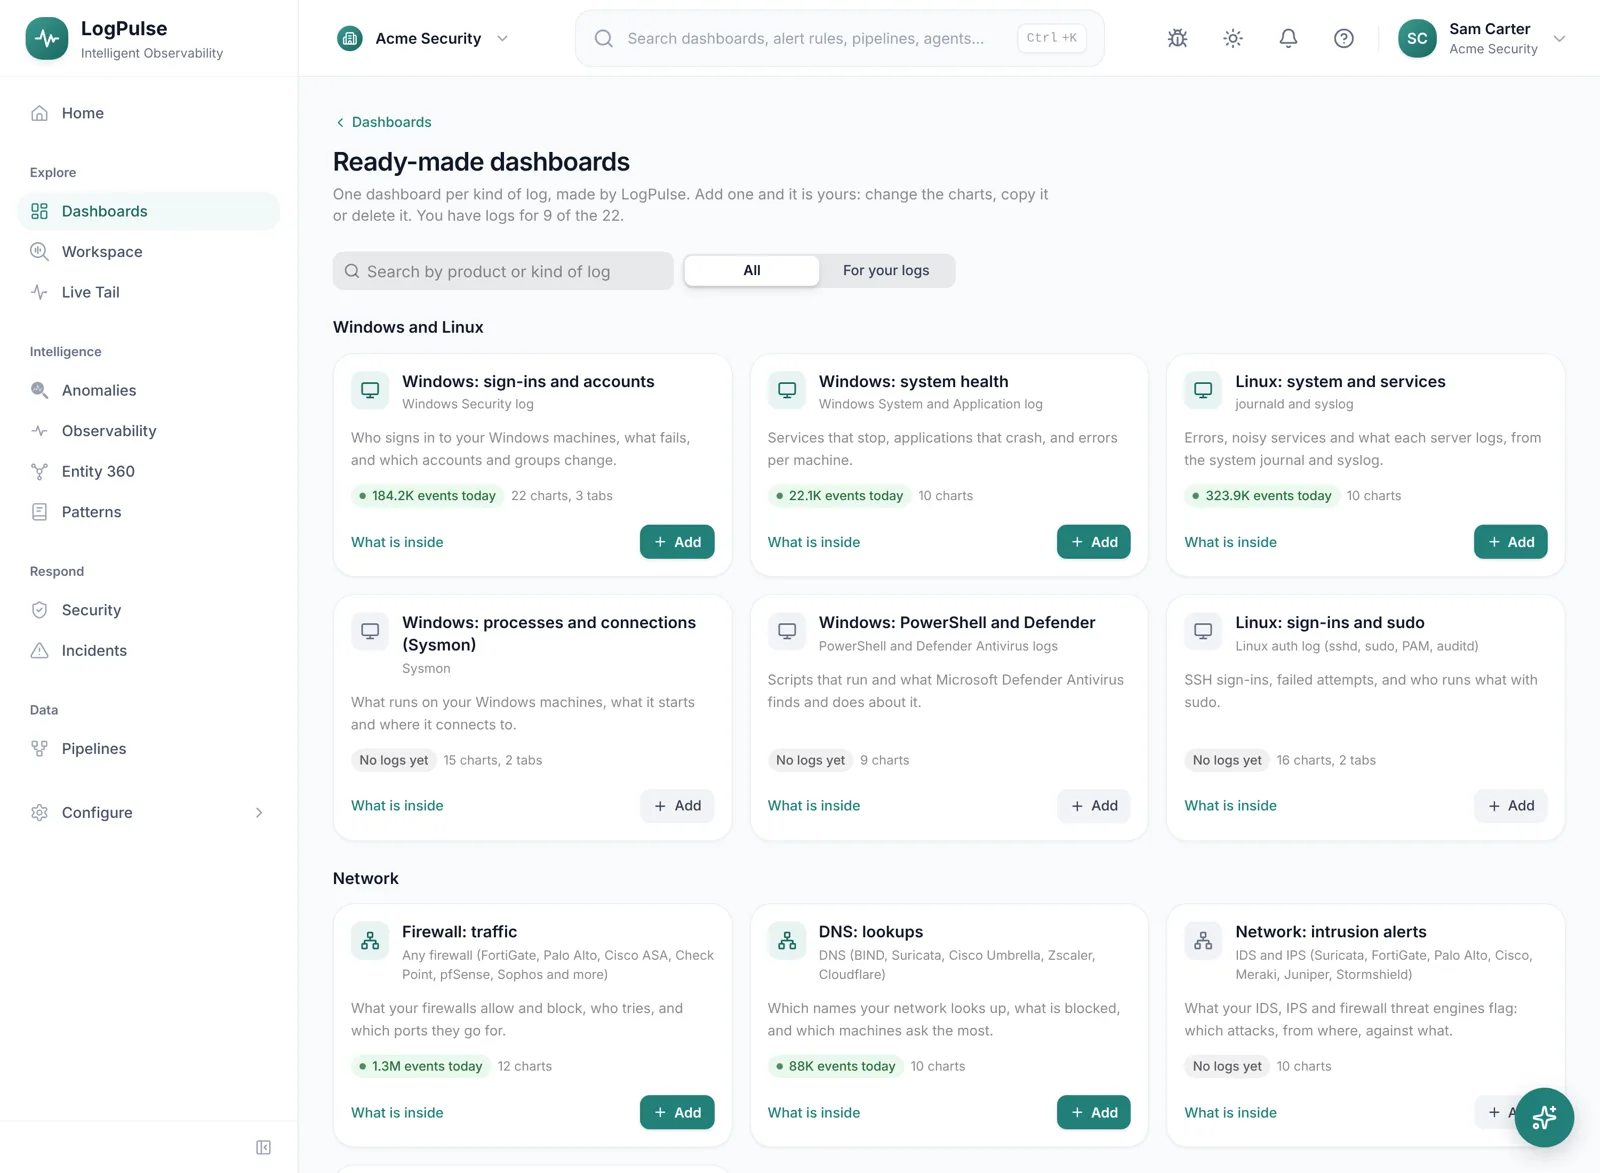
A dashboard is made per kind of log, not per brand. Firewall: traffic works for FortiGate, Palo Alto, Cisco ASA and every other firewall, because LogPulse gives their logs the same field names (src_ip, dest_port, action). Where a product has its own story, such as Sysmon, AWS CloudTrail or Microsoft 365, it has its own dashboard.
What is in the library
| Dashboard | For | Shows |
|---|---|---|
| Windows: sign-ins and accounts | Windows Security log | Who signs in to your Windows machines, what fails, and which accounts and groups change. |
| Windows: system health | Windows System and Application log | Services that stop, applications that crash, and errors per machine. |
| Windows: processes and connections (Sysmon) | Sysmon | What runs on your Windows machines, what it starts and where it connects to. |
| Windows: PowerShell and Defender | PowerShell and Defender Antivirus logs | Scripts that run and what Microsoft Defender Antivirus finds and does about it. |
| Linux: sign-ins and sudo | Linux auth log (sshd, sudo, PAM, auditd) | SSH sign-ins, failed attempts, and who runs what with sudo. |
| Linux: system and services | journald and syslog | Errors, noisy services and what each server logs, from the system journal and syslog. |
| Firewall: traffic | Any firewall (FortiGate, Palo Alto, Cisco ASA, Check Point, pfSense, Sophos and more) | What your firewalls allow and block, who tries, and which ports they go for. |
| Network: intrusion alerts | IDS and IPS (Suricata, FortiGate, Palo Alto, Cisco, Meraki, Juniper, Stormshield) | What your IDS, IPS and firewall threat engines flag: which attacks, from where, against what. |
| Network: VPN and device sign-ins | VPN, NAC and device logins (Cisco ASA and ISE, Palo Alto GlobalProtect, FortiGate, Meraki, Cisco IOS) | Who signs in to the VPN, the network and your network devices, and what fails. |
| DNS: lookups | DNS (BIND, Suricata, Cisco Umbrella, Zscaler, Cloudflare) | Which names your network looks up, what is blocked, and which machines ask the most. |
| Identity: sign-ins | Entra ID, Okta, Cisco Duo, Google Workspace | Sign-ins to Entra ID, Okta, Duo and Google Workspace: who, from where, with or without MFA. |
| Endpoint: alerts and detections | Microsoft Defender XDR, CrowdStrike Falcon, SentinelOne, Sophos, Trend Micro | What your EDR finds: alerts per severity, machine and user, and what was done about them. |
| Web servers: traffic and errors | nginx, Apache, IIS, HAProxy, Java access logs | Requests, errors, slow pages and who is calling, for nginx, Apache, IIS and HAProxy. |
| Web proxy: what people browse | Squid, Blue Coat, Zscaler, Netskope, Cisco Umbrella, Meraki | Sites people visit through the proxy, what is blocked and why. |
| Email: delivery and threats | Postfix, FortiMail, Cisco Secure Email, Exchange Online, Defender for Office 365, Proofpoint, Mimecast | Mail that arrives, bounces or is blocked, and who sends and receives the most. |
| Cloud: who changed what | AWS CloudTrail, Azure Activity, Microsoft 365, Google Workspace and Cloud, GitHub, Slack, Atlassian | Admin and user activity across AWS, Azure, Microsoft 365, Google and GitHub: actions, failures and who does the most. |
| AWS: CloudTrail | AWS CloudTrail | API calls in your AWS accounts: who, which service and region, console sign-ins and what is denied. |
| Microsoft 365: activity | Microsoft 365 audit log | What people do in Exchange, SharePoint, OneDrive and Teams, and what admins change. |
| GitHub: activity and builds | GitHub audit log and Actions | Who changes what in your GitHub organization, and how your workflows are doing. |
| Kubernetes: clusters | Kubernetes pod logs and audit log | What your pods log, which ones fail, and who does what through the API. |
| Docker: containers | Docker | What your containers log, which ones are noisy and which ones fail. |
| Hypervisors: VMware and Proxmox | VMware vSphere, Proxmox | What your hypervisors report: errors, sign-ins and which hosts are busiest. |
Making one your own
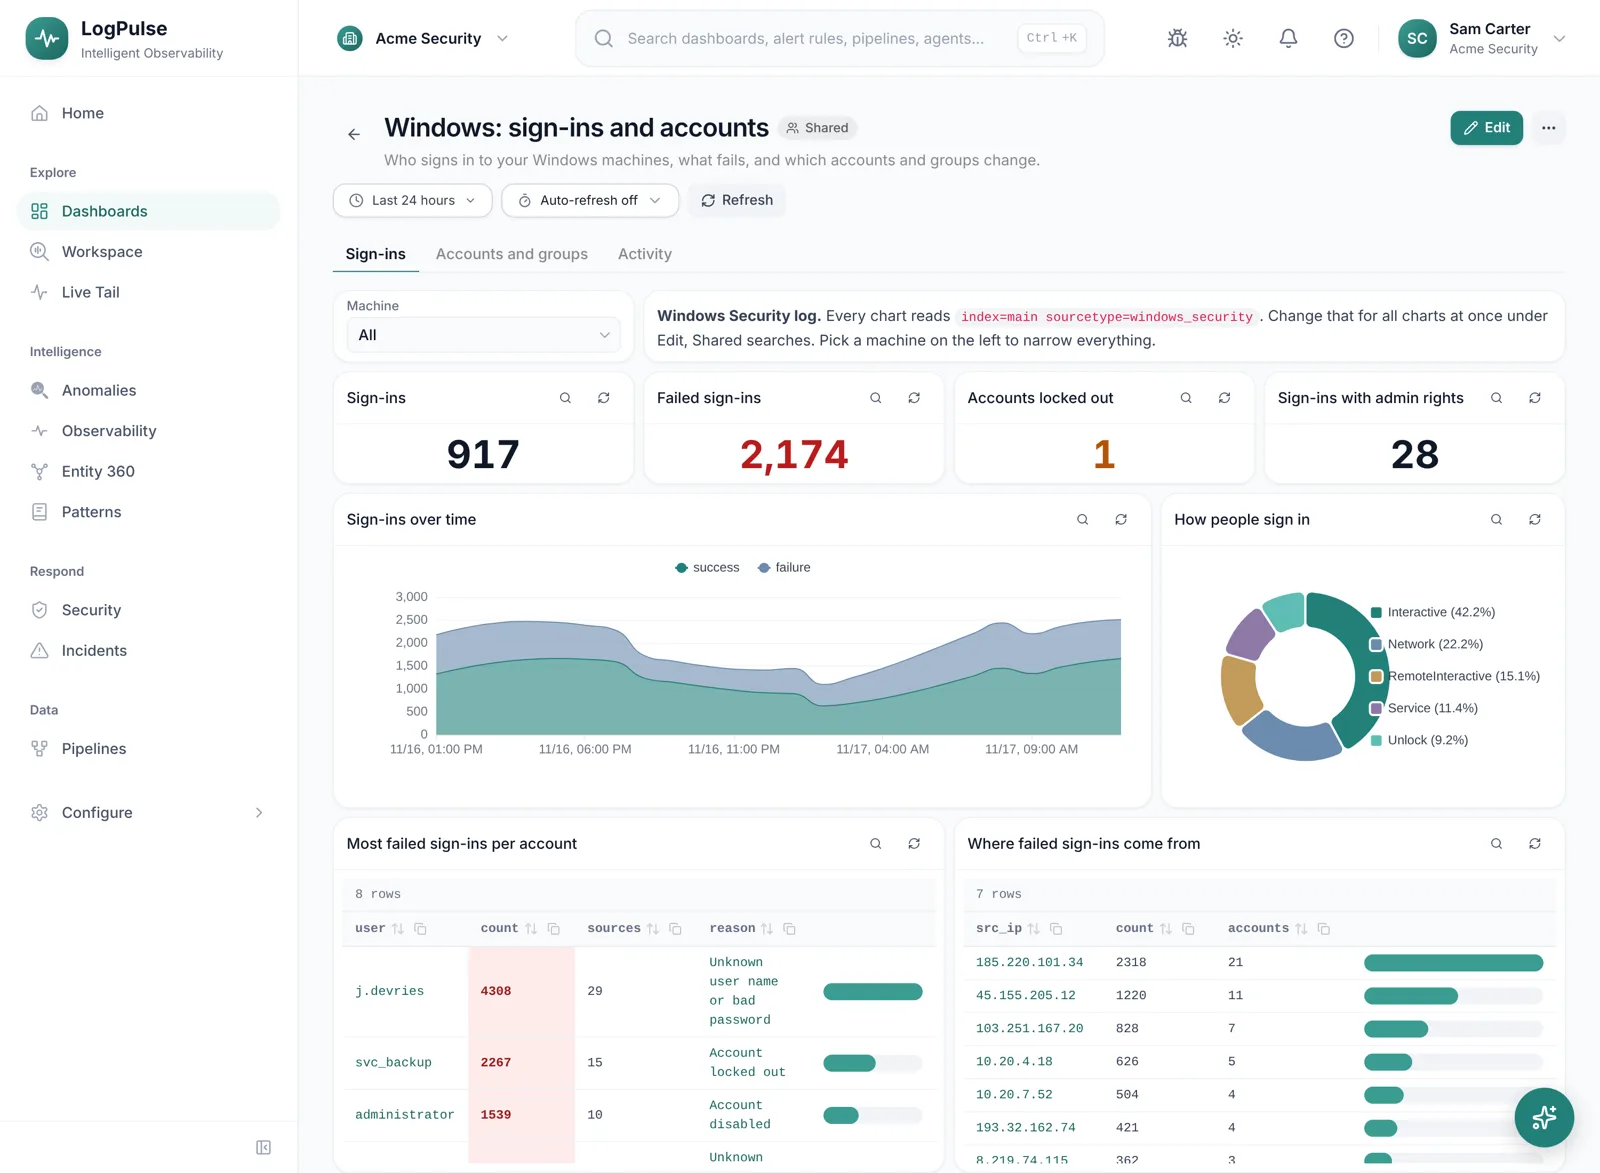
Every ready-made dashboard is built the same way, so you know where to look:
| Part | What it does | How to change it |
|---|---|---|
| One shared search | Every chart starts from the same search, for example index=windows sourcetype=windows_security. LogPulse writes it from where your logs really are, also when they sit in another index. | Edit, then Shared searches. Change that one line and all charts follow. |
| Machine filter | Narrows every chart to one machine. | Edit the filter to pick on another field, or add a second filter. |
| Tabs | Bigger dashboards split their story, such as Sign-ins, Accounts and groups, Activity. | Rename, add or remove tabs in the editor. |
| Clicks | A click on a row or bar filters the dashboard or opens the events behind it in Search. | Select the panel, then On click. |
| Colours | Numbers that need attention turn amber or red, such as a cleared security log. | Select the panel, then Colour by value. |
Want a second version, for one team or one site? Use Clone on the dashboard and narrow the shared search of the copy, for example with host=ams-*. You can also ask the AI assistant to change a ready-made dashboard: it is a normal dashboard once it is yours.
Grid or canvas
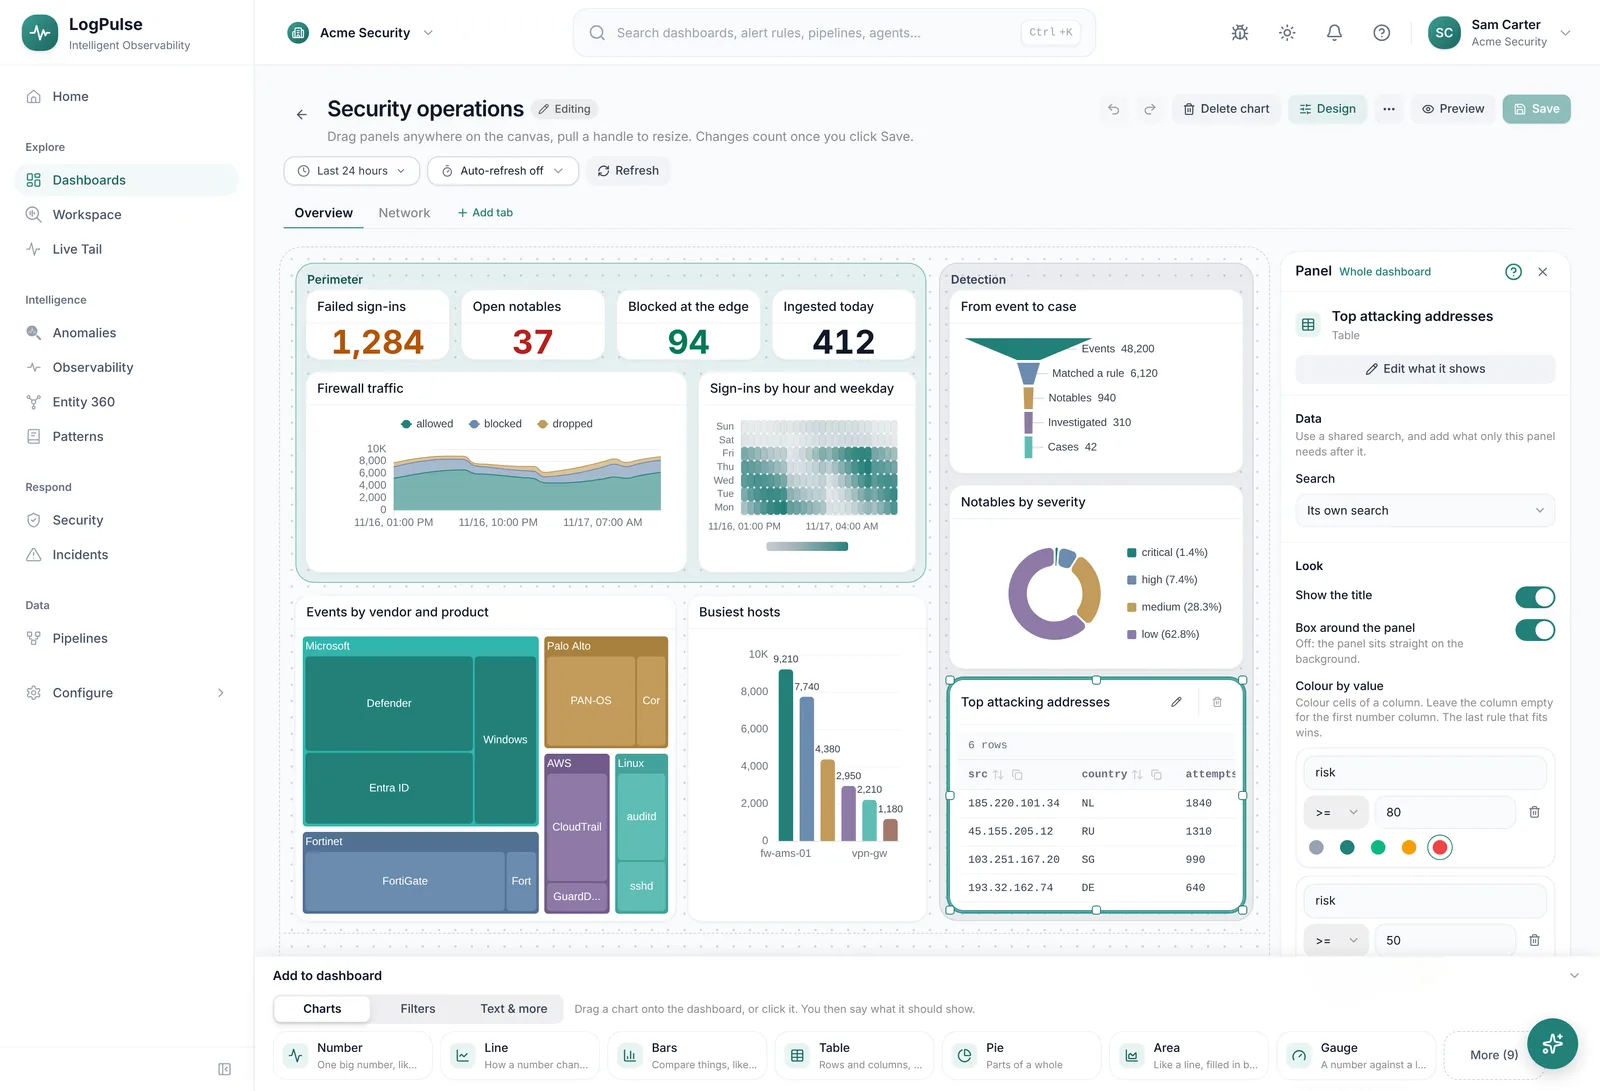
Open Design in the editor (with no panel selected) and pick a Layout. You can switch at any time: panels keep their place.
| Grid | Canvas | |
|---|---|---|
| How panels find their place | In rows of 24 columns. Panels never overlap | Exactly where you put them, in pixels. Panels may overlap |
| Best for | Almost every dashboard | A wall screen, a floor plan or network drawing, a designed report |
| On another screen size | Rearranges by itself | Scales as a whole, like a picture |
| Groups (collapsible sections) | Yes | No, use tabs and shapes |
Start with the grid. Choose the canvas when the place of a panel means something, for example a number on top of the room it belongs to, or when the dashboard has to fill one screen exactly.
Working on the canvas
| To | Do this |
|---|---|
| Move a panel | Drag it by its title, or select it and use the arrow keys |
| Move in larger steps | Hold Shift with the arrow keys |
| Resize | Drag one of the eight handles around a selected panel |
| Put a panel on top of or behind another | Select it and choose To the front or To the back under Design |
| Type an exact place and size | Design, Place and size |
| Copy and paste | Ctrl+C and Ctrl+V (Cmd on a Mac) |
| Remove | Delete |
| Undo and redo | Ctrl+Z and Ctrl+Shift+Z |
Panels snap to an invisible raster while you drag, so edges line up by themselves. Set it under Snap while dragging: Off, Fine, Normal or Coarse.
Size, background and picture
The canvas has a width and a height in pixels. Pick a preset or type your own. The dashed line in the editor shows where the canvas ends; panels below it still show, the page just gets longer.
| Preset | Size | For |
|---|---|---|
| Desktop | 1440 x 900 | A laptop or monitor |
| Wide screen | 1920 x 1080 | A TV on the wall |
| Long page | 1440 x 1800 | A report you scroll through |
Under Background you choose None, Sheet, Tinted or Dots, and you can put a picture behind everything: a floor plan, a network drawing, a map of the office. Upload a PNG, JPEG, WebP or GIF, or give a link that starts with https://. Choose whether the picture shows as a whole or fills the canvas.
Panels
Charts and their searches
Every chart draws the result of one search. The table says what that result should look like.
| Panel | Shows | The search returns | Example |
|---|---|---|---|
| Number | One big number | One row with one number | index=web level=error | stats count |
| Gauge | A number against a limit | One number | index=os | stats avg(cpu_pct) |
| Line, Area | How a number changes over time | Time and one or more numbers | index=web | timechart count by status |
| Bars | A number per thing | A name and a number | index=web level=error | top host |
| Pie | Parts of a whole, up to about six | A name and a number | index=web | stats count by method |
| Table | Rows and columns | Anything | index=iam action=failure | stats count by user, src |
| Scatter | Two numbers against each other | Two numbers per row | index=web | stats avg(duration), count by uri |
| Map | Where in the world | A place and a number | index=firewall | iplocation src | stats count by Country |
| Flow, Relations | From where to where | Two names and a number | index=firewall | stats count by src_zone, dest_zone |
| Heatmap | Where and when it is busiest | Two names and a number | below |
| Tiles | What takes up the most | One or two names and a number | below |
| Funnel | How many are left per step | Steps in order with a number | below |
| KPI, Service health | A goal or the health of a service from Service Intelligence | No search: you pick the KPI or services |
Heatmap, tiles and funnel
A heatmap is a table of coloured cells: the darker, the more. Use it to see when and where something is busiest, such as failed sign-ins per hour and per country.
index=iam action=failure
| eval hour=strftime(_time, "%H")
| stats count by src_country, hour
Tiles (a treemap) show what takes up the most: every tile is as large as its share. With two group-by fields the tiles are grouped, for example hosts inside their application.
index=web | stats sum(bytes) as bytes by app, hostA funnel shows how many are left after every step, from the most at the top to the fewest at the bottom: events, alerts, notables, cases.
index=web
| stats count(eval(uri="/cart")) as "Cart",
        count(eval(uri="/checkout")) as "Checkout",
        count(eval(uri="/paid")) as "Paid"
| transpose
Text, shapes and pictures
| Panel | For |
|---|---|
| Text | A heading, an explanation or links, written in Markdown |
| Shape | A box, circle or line behind or between panels, to show what belongs together. Pick a calm colour, filled or outline only, and a few words inside it, such as the name of a zone |
| Picture | A logo, a floor plan or a drawing. Add a description: it is read aloud for people who cannot see the picture |
Every panel has two switches under Design: Show the title and Box around the panel. Turn both off for a number that sits straight on a floor plan.
Tabs
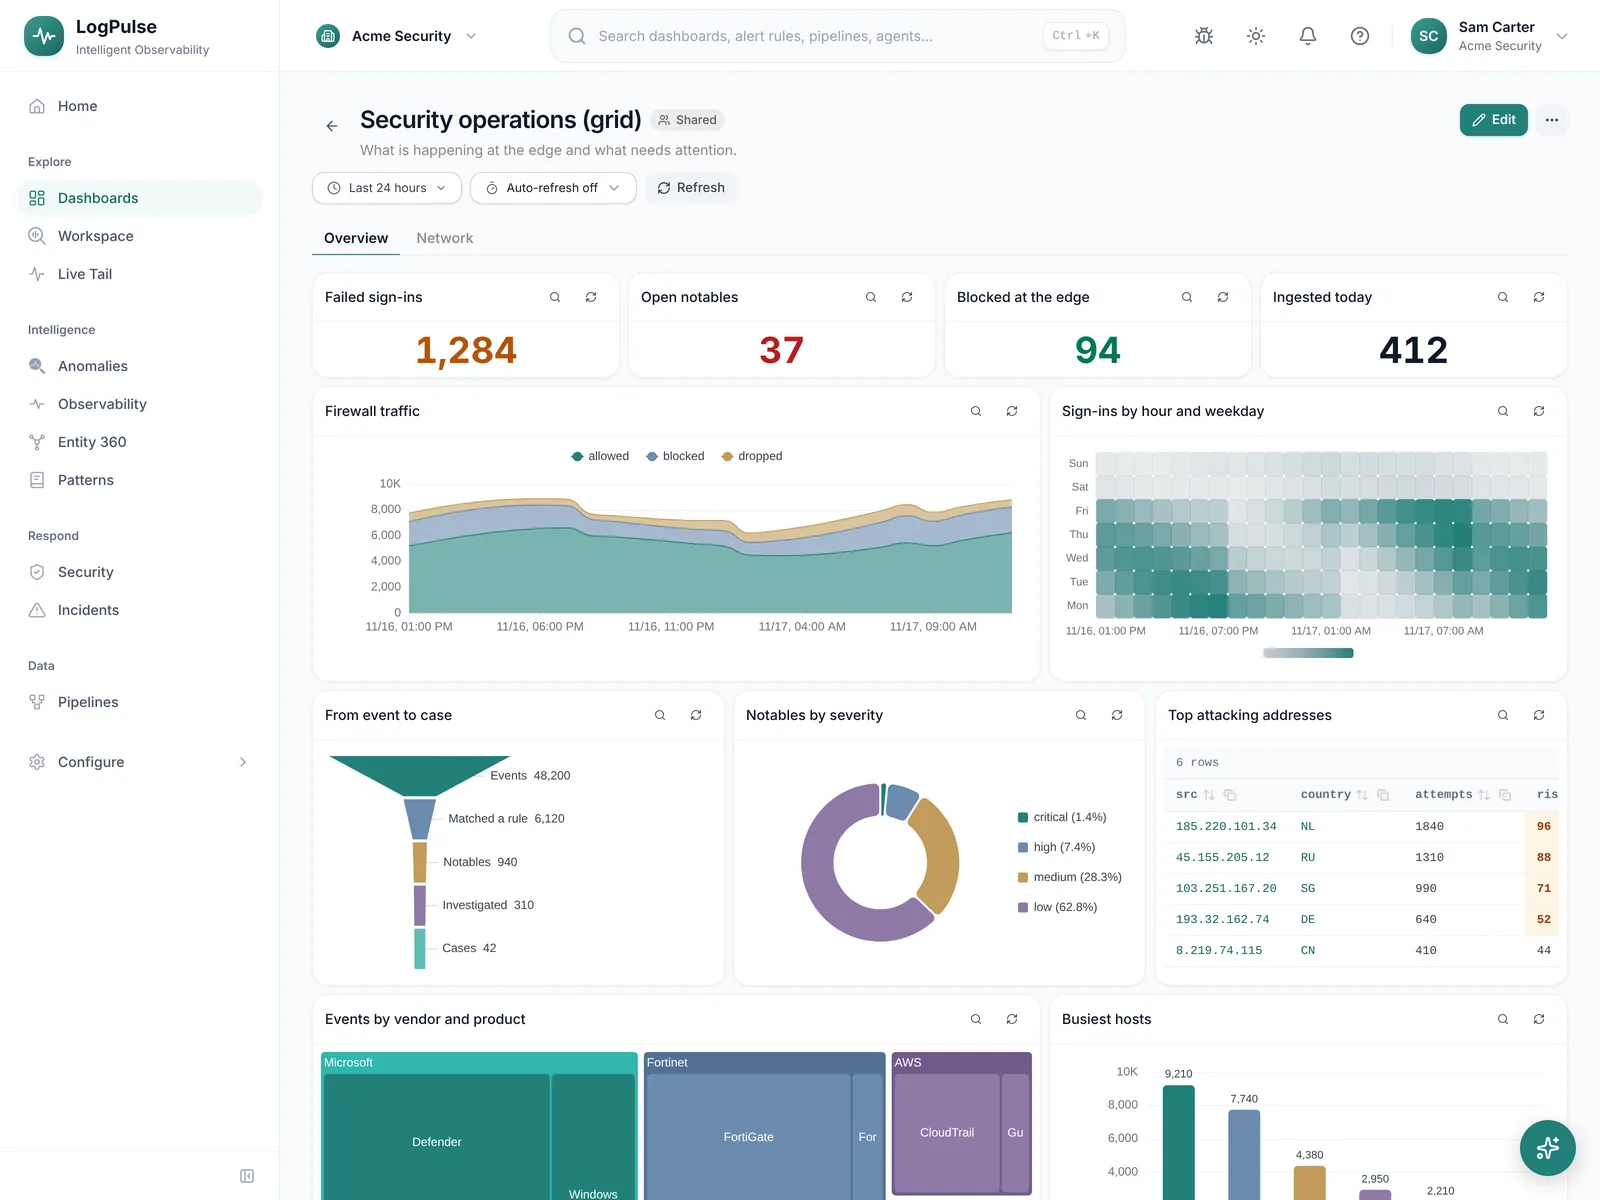
Tabs split a large dashboard in pages, such as Overview, Network and Identity. Add them under Design, Tabs. Select a panel and choose Tab the panel is on to move it, or choose Every tab for a filter or a heading that should always be there.
| Good to know | |
|---|---|
| Only the open tab runs its searches | A dashboard with many tabs opens as fast as its first tab |
| The open tab is in the address | Send someone the link and they land on the same tab (?tab=network) |
| Filters and time apply to every tab | Pick a server once, and every tab shows that server |
| Delete a tab | Its panels move to the first tab. Nothing is lost |
Look
Under Design, Look, you set how the whole dashboard is drawn.
| Setting | Choices | What it does |
|---|---|---|
| Chart colours | Petrol, Ocean, Earth, Mono, Status | The colours of lines, bars and tiles. All are calm and work in light and dark. Status uses green, amber and red, for charts where colour means good or bad |
| How panels are drawn | Cards, No box, Tinted | A card around every panel, nothing at all, or a soft tint |
| Light or dark | Like the app, Always dark | Always dark keeps the dashboard dark, also when the app is light. For a screen on the wall |
| Room around the content | Roomy, Compact | Compact fits more panels on one screen |
There is no free colour picker on purpose: a fixed set of calm colours keeps every dashboard readable, also for people who see colours differently, and keeps red for things that need action.
Filters
A filter is a choice at the top of the dashboard, such as a server, a user or a zone. Everyone who opens the dashboard can change it, without touching a search.
Kinds of filters
| Filter | What people see | Use it for |
|---|---|---|
| Whole dashboard | A row of choices such as server, zone and application | Narrowing every chart at once, without changing any search |
| Pick from a list | A drop-down | One host, user or environment |
| Pick several | A drop-down with ticks | More than one value at a time |
| Type a value | A text box | A user name, an IP address, a ticket number |
| Buttons, Checkboxes, Links | All options visible | A handful of fixed choices |
| Number, On/off | A number box or a switch | A limit, or showing and hiding detail |
| Time | A second time picker | A few charts with their own time |
The options of a list come from a fixed list you type, from one field (field=host) or from a search (index=web | stats count by host).
Using a filter in a search
Every filter has a name. Write $name in a search and the dashboard fills in what was picked. With nothing picked, the filter means everything.
index=web host=$host level=error | timechart count| Picked | The search that runs |
|---|---|
| web-1 | index=web host=web-1 level=error | timechart count |
| web-1 and web-2 (Pick several) | index=web (host="web-1" OR host="web-2") level=error | timechart count |
| Nothing | index=web host=* level=error | timechart count |
Picked values are also in the address of the page (?var-host=web-1), so a link you send opens with the same choices.
What a click does
Select a panel and open Design, When someone clicks. A click on a bar, a slice, a point or a table cell then does one of these things. Splunk calls this a drilldown.
| Choice | What happens | Use it for |
|---|---|---|
| Filter the whole dashboard | Every chart narrows to the clicked value. A chip at the top shows it and removes it again | Exploring: click a server, see only that server. This is what a click does when you set nothing |
| Fill in a filter of this dashboard | The clicked value lands in a filter you choose | A list that drives a detail panel on the same dashboard |
| Open another dashboard | The other dashboard opens with filters filled in, and the same time if you want | From an overview to the dashboard of one server or one user |
| Open Search | Search opens with a query you wrote, with the clicked value in it | From a number to the events behind it |
| Open a link | A page opens: a ticket, a runbook, a page in another tool | Anything outside LogPulse |
| Nothing | A click does nothing | Panels where a click would only confuse |
Values you can use
In the query, the link and the filter values you can use what was clicked:
| Write | You get | Example |
|---|---|---|
$click.value | The value that was clicked | web-1 |
$click.field | The field that value belongs to | host |
$row.column | Another column of the same table row | $row.user, $row.src |
$name | What is picked in a filter of the dashboard | $env |
index=iam action=failure user="$row.user" src="$row.src"https://tickets.example.com/browse/$row.tickethttps:// or be a path inside LogPulse, such as /incidents. Other links are refused when you save. Values are made safe before they go into a query or a link, so a strange host name cannot break the search.Recipe: list and detail
A list on the left, and on the right the detail of the row you click.
- Add a filter Type a value and name it
user. - Add a table:
index=iam action=failure | stats count by user | sort -count. Under When someone clicks choose Fill in a filter of this dashboard and pickuser. - Add the detail panel:
index=iam user=$user | timechart count by action. Under Show only when pick the filteruserand is picked. - Add a Text panel that says Pick a user in the list, with Show only when set to is empty, on the same place.
Show only when
A panel can wait for a filter. Select the panel and open Design, Show only when: pick the filter the panel depends on and a condition.
| Condition | The panel shows when |
|---|---|
| Is picked | Something is picked in the filter |
| Is empty | Nothing is picked, or All |
| Is | The filter has exactly this value |
| Is not | The filter has another value |
A hidden panel does not run its search, so a dashboard with many detail panels stays fast. In the editor hidden panels stay visible, with a note that says when they show.
Colour by value
A Number panel and the columns of a Table can change colour with their value. Select the panel, open Design and add rules: a comparison, a number and a colour.
| Rule | Result |
|---|---|
| Above 10: amber | From 11 the number is amber |
| Above 50: red | From 51 the number is red |
Rules are read from top to bottom and the last one that fits wins, so write them from mild to severe. In a table a rule belongs to one column. The colours are grey, petrol, green, amber and red.
Time, refresh and wall screens
| Setting | What it does |
|---|---|
| Time range | The time picker at the top sets the time for every panel. A panel can have its own time, for example always the last hour |
| Auto-refresh | Off, or every 30 seconds, 1 minute, 5 minutes or 15 minutes |
| TV mode | The dashboard on a full screen without the app around it. It refreshes by itself and can move on to the next dashboard every few minutes. Everything is in the address, so a TV can keep a bookmark |
| Always dark | Under Look: keeps a wall screen dark, whatever the app is set to |
For a wall screen: choose the canvas with the preset Wide screen, set Always dark, keep to six to ten panels with large numbers, and open it in TV mode.
Phone, email and share links
A dashboard is built once and works everywhere. This is what each place shows.
| Where | What you see |
|---|---|
| Browser on a computer | Everything on this page |
| Phone | Panels below each other, in reading order. Tabs, filters and click actions work |
| Emailed report | The panels as a list, every morning or every Monday, including heatmap, tiles and funnel |
| Share link | A snapshot without signing in: tabs, the look, colour rules and pictures. Clicks do nothing there, and shapes are left out |
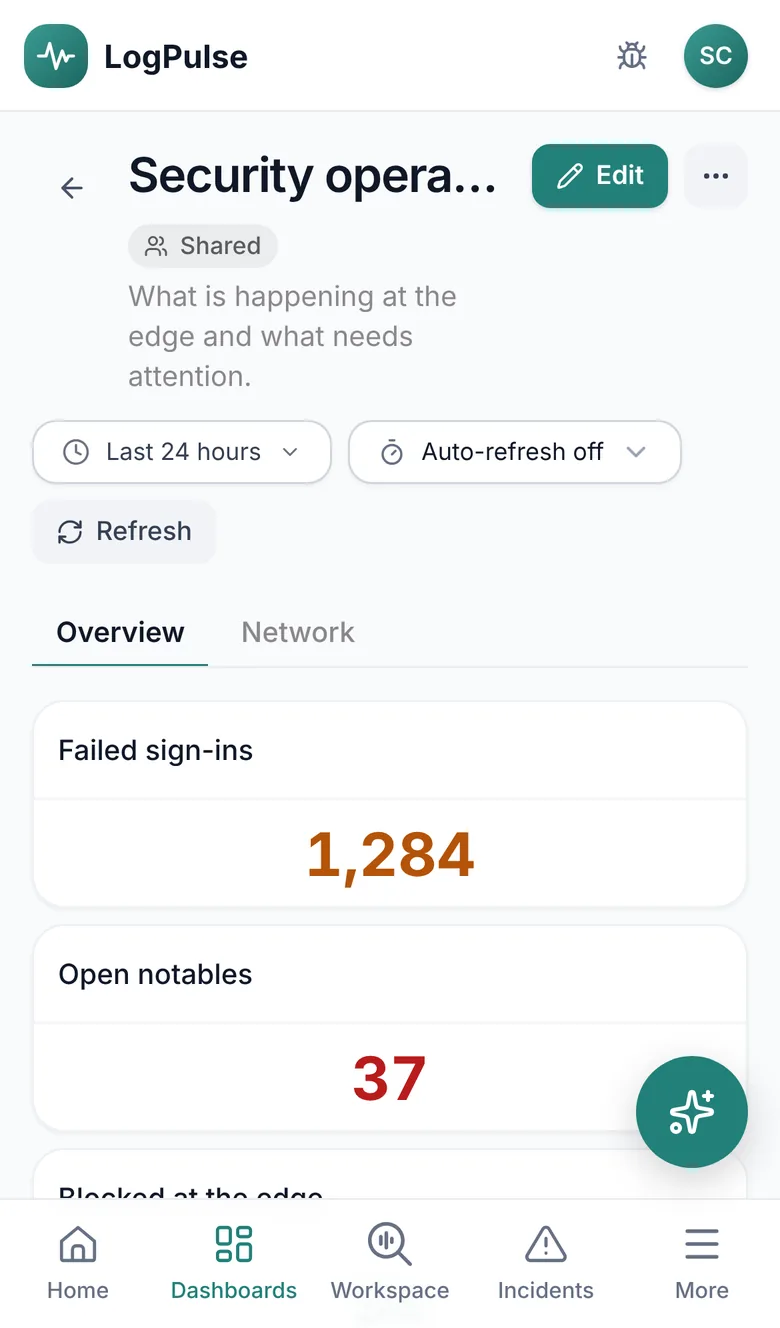
You never design a second version. A canvas dashboard also remembers the nearest place on the grid for every panel, and that is what a small screen, an email and a share link use. See Dashboard & UI for share links and versions.
Let the AI assistant build it
You do not have to build a dashboard by hand. Open the assistant in LogPulse and say what you want to see. It looks at the data you really have, writes the searches, tries every one of them, and then makes the dashboard or changes the one you have. It can use everything on this page: canvas, tabs, the look, filters, click actions, show only when, colour rules and shared searches.
What to ask
| Ask | What you get |
|---|---|
| Make a dashboard for failed sign-ins: a number, the trend, and a table per user. | A grid dashboard with three panels, private to you |
| Make a SOC dashboard for the screen on the wall, dark, with tabs for Overview and Network. | A wide canvas, always dark, with two tabs and large numbers |
| Add a filter for the server to my Web errors dashboard and use it in every panel. | A list filter, and every search narrowed with it |
| When I click a user in that table, show their sign-ins next to it. | A click action that fills a filter, and a detail panel that shows after a click |
| Make the number amber above 10 and red above 50. | Two colour rules on that panel |
| Clicking a host should open the Host detail dashboard for that host. | A click action to the other dashboard, with the host filled in |
| Move the map to the Network tab and make the table twice as wide. | The panel on another tab, with a new place |
| These three panels use the same search. Make it a shared search. | One shared search, and three panels that build on it |
Say it in your own words. You do not need the names on this page: the assistant picks the chart that fits the question and tells you in plain language what the dashboard shows and what a click does.
What it checks and what it leaves to you
| The assistant | |
|---|---|
| Runs every search first | Over the last 15 minutes. A search that does not run, or that reads every index without need, is refused before anything is made |
| Asks or applies, as you set it | Under Settings, AI, you choose per kind of change whether it is applied at once or waits for a person to approve. You see the whole change first: every panel, its search, how many rows it returned, where it sits and what a click does |
| Never overwrites your work | If someone changed the dashboard after the assistant looked at it, the change is refused and the assistant looks again |
| Keeps a new dashboard private | Unless you ask to share it with the organization |
| Only links to safe places | A click can open an https link or a page inside LogPulse, and only a dashboard you may open yourself |
| Can be undone | Every change is a version of the dashboard you can restore, and the assistant can revert its own change |
These stay with you in the editor:
| Not by the assistant | Why |
|---|---|
| A share link | Publishing data outside your organization is a decision for a person |
| A button | A button runs an action on a click; you add it yourself |
| Uploading a picture | The assistant can place a picture from an https link. Uploading a file from your computer happens in the editor |
get_dashboard, propose_dashboard and propose_dashboard_panel.Recipes
| Dashboard | How to build it |
|---|---|
| Service overview | Grid. Top row: four Numbers (requests, errors, error rate, slowest response) with colour rules. Below: a Line of errors over time, Bars per server, and a Table of the most common errors. A filter for the environment |
| SOC wall screen | Canvas, Wide screen, Always dark, Compact. Large Numbers for open notables and failed sign-ins, a Funnel from events to cases, a Heatmap of sign-in failures per hour and country, a Map. Open it in TV mode |
| Network on a drawing | Canvas with your network drawing as the picture behind everything. A Number without title and box on every firewall, with colour rules. A click on a Number opens Search for that firewall |
| Investigate one user | Grid with a filter Type a value named user. Every search uses $user. Reach it from other dashboards with the click action Open another dashboard |
| Monthly report | Canvas, Long page, panels drawn with No box. Text panels between the charts explain what you see. Send it as an emailed report |
Coming from Splunk
If you know Splunk Dashboard Studio, you know most of this page under other names. See also Migrating from Splunk.
| In Splunk | In LogPulse |
|---|---|
| Grid layout, Absolute layout | Grid, Canvas |
| Tabs | Tabs |
| Inputs | Filters |
| Tokens | The name of a filter, written as $name in a search |
| Drilldown | What a click does |
$click.value$, $row.field.value$ | $click.value, $row.field |
| Set token on click | Fill in a filter of this dashboard |
| Link to dashboard, to search, to custom URL | Open another dashboard, Open Search, Open a link |
| Show or hide a panel with a token | Show only when |
| Base search and chain search | Shared search and the steps after it (Then) |
| Dynamic colouring with ranges | Colour rules |
| Rectangle, ellipse, line, image, Markdown | Shape, Picture, Text |
| Background image | The picture behind the canvas |
| Dark theme | Always dark |
| SPL | LPQL, which reads almost the same |
Reference
For people who create dashboards from a script or an AI tool. Everything below is optional: leave it out and you get a plain grid dashboard.
Dashboard settings
The field settings of a dashboard.
{
  "layout": {
    "mode": "canvas",                  // "grid" (default) or "canvas"
    "canvas": {
      "width": 1920, "height": 1080,   // pixels
      "snap": 8,                       // raster while dragging, 0 is free
      "background": "none",            // none | plain | tinted | grid
      "image": "https://example.com/floor-plan.png",
      "imageFit": "contain"            // contain | cover
    }
  },
  "tabs": [
    { "id": "overview", "title": "Overview" },
    { "id": "network", "title": "Network" }
  ],
  "theme": {
    "palette": "petrol",               // petrol | ocean | earth | mono | status
    "panelStyle": "card",              // card | flat | tinted
    "appearance": "app",               // app | dark (always dark)
    "density": "comfortable"           // comfortable | compact
  },
  "searches": [
    { "id": "fw", "name": "Firewall denies", "query": "index=firewall action=deny" }
  ]
}
Panel settings
A panel keeps these under config.studio. Every part is optional.
{
  "frame": { "x": 16, "y": 96, "w": 464, "h": 280, "z": 1 },  // place on the canvas, z: higher lies on top
  "tabId": "network",                                          // a tab id, or "*" for every tab
  "search": { "id": "fw", "then": "stats count by src" },      // a shared search and the steps after it
  "drilldown": { "type": "token", "token": "src", "value": "$click.value" },
  "showWhen": { "token": "src", "op": "set" },                 // set | unset | equals | not_equals (+ value)
  "colorRules": [
    { "op": ">", "value": 10, "tone": "amber" },
    { "column": "count", "op": ">", "value": 50, "tone": "red" }
  ],
  "style": { "hideTitle": true, "surface": "none" },           // surface: card | none
  "shape": { "kind": "rectangle", "tone": "petrol", "fill": true, "label": "DMZ" },
  "image": { "src": "https://example.com/logo.png", "fit": "contain", "alt": "Company logo" }
}| drilldown.type | Other fields |
|---|---|
filter | None. Narrows every chart to the clicked value (default) |
token | token, value (default $click.value) |
dashboard | dashboardId, tokens (filter name to value), keepTime (default true) |
search | query |
url | url (https or a path inside LogPulse), newTab (default true) |
none | None |
On a canvas a panel also keeps gridX, gridY, gridW and gridH: the nearest place on the grid of 24 columns, used on a phone, in an email and on a share link. A panel on a shared search keeps the whole search in query as well.
API and MCP
| Call | What it does |
|---|---|
POST /api/v1/dashboards | Create a dashboard, with settings |
PUT /api/v1/dashboards/:id | Change it. settings: null makes it a plain grid dashboard again |
PUT /api/v1/dashboards/:id/config | Save the whole dashboard (settings, panels, groups, layout) at once, as the editor does |
/api/v1/dashboards/:id/panels | Add, change or remove panels, with config.studio |
| MCP tool | What it does |
|---|---|
list_dashboards | The dashboards you may see |
get_dashboard | One dashboard with its settings and every panel |
propose_dashboard | Create a dashboard with its panels, change its name, visibility, layout or settings, or delete it |
propose_dashboard_panel | Add, change or remove one panel. studio sets the panel settings above and is merged into what the panel has |
Over MCP nothing is written directly: a proposal is checked against your data and then applied or reviewed, as your organization has set it. See the MCP server page.
Limits
| What | Limit |
|---|---|
| Panels on a dashboard | 100 |
| Tabs | 12 |
| Shared searches | 20 |
| Colour rules on a panel | 8 |
| Canvas width | 320 to 7680 pixels |
| Canvas height | 200 to 20000 pixels |
| An uploaded picture | About 300 KB; PNG, JPEG, WebP or GIF. Use a link for larger pictures |
| Links | Must start with https://, or be a path inside LogPulse |
See Platform limits for the number of dashboards in your plan.
Questions
| Question | Answer |
|---|---|
| My panel says it waits for a filter | The panel has Show only when set. Pick a value in the filter it names, or remove the condition under Design |
| A click does nothing | Check When someone clicks on that panel. On a share link clicks never do anything |
| I switched from canvas to grid and back. Is my design gone? | No. As long as you did not move panels on the grid in between, every panel returns to its place on the canvas |
| A panel is behind another and I cannot reach it | Select the panel on top and choose To the back |
| My heatmap is empty | The search has to return two names and a number, for example stats count by host, hour |
| The filter shows no options | Check the search of the filter in Search first. field=host lists the values of one field |
| Can a colleague change my dashboard? | The owner can always change a dashboard, and so can admins and owners of the organization. Others see it when its visibility is Organization |
| I made a mistake | Undo with Ctrl+Z while editing. After saving, restore an earlier version under Versions |
| Will my old dashboards change? | No. They open as grid dashboards exactly as before, until you choose something on this page |